
On the one hand, it’s a great story. In 2016, just 4% of Americans had access to a gigabit connection. Fast forward to 2020, and now a staggering 84% of Americans reportedly have that same luxury. If you took the U.S. government’s data at face value, this is what you’d be led to believe. Unfortunately, it isn’t based in reality.
Progress on gigabit deployment in the U.S. has been greatly exaggerated. This is true for the state of the internet in general, as we’ve previously illustrated. However, the gigabit landscape is a subsection worth examining more closely, as it is the connectivity threshold that will be required to solve the speed and functionality divides of the near future.
The FCC claims that gigabit availability has ballooned from 4% in 2016 to 84% in 2020. Our own estimates, however, show that gigabit plan access has actually gone from 2.4% in the same year to 56% in 2020.
Key Findings
- According to the FCC, gigabit internet availability has seen explosive growth over the past four years, rising from just 4% in 2016 to over 84% in 2020.
- These numbers aren’t reflective of consumer reality, however, with only 56% of Americans having an active gigabit plan in their zip code in 2020 (even this number is likely overstated).
- We manually checked 75 addresses in zip codes where the FCC shows gigabit coverage, but BroadbandNow data shows that there is not an internet plan sold at that speed. We checked these addresses by calling internet service providers and asking if gigabit service was available. In all 75 cases, none of them had a gigabit service available.
- In areas where gigabit service is available, pricing has stabilized somewhat: median price for specific plans has dropped by 27%, from $109.00 in 2016 to $79.99 today.
- In 2016, 115 providers were servicing residents in 32 states. In 2020, 479 providers now claim gigabit coverage to areas in all 50 states.
In the table below, you can compare the FCC’s estimates to our own over the past four years. You can also see average and median lowest cost of plans in our database over that span of time:
| Year | % Population with FCC-Reported Coverage | % Population With Gigabit Plan Access | Number of Providers with gig plans | Number of zip codes including gig plans | Number of zip codes including gig coverage | Average lowest price gig plan | Median lowest price gig plan | Number of states with gig plans (out of 51) |
|---|---|---|---|---|---|---|---|---|
| 2016 | 3.9% | 2.4% | 115 | 1,684 | 4,216 | $107.52 | $109.00 | 32 |
| 2017 | 7.3% | 4.1% | 171 | 2,510 | 6,559 | $90.74 | $99.00 | 38 |
| 2018 | 38.3% | 25.1% | 278 | 8,363 | 14,175 | $90.69 | $90.00 | 45 |
| 2019 | 66.5% | 45.4% | 369 | 16,665 | 20,615 | $96.34 | $79.99 | 49 |
| 2020 | 84.4% | 56.1% | 479 | 19,192 | 24,624 | $93.88 | $79.99 | 50 |
Gigabit reported coverage vs plan coverage
So, how exactly did gigabit coverage expand by more than 80% in the U.S. since 2016? To answer this, it is first important to clarify the difference between “reported” coverage and “plan” coverage. Reported coverage is derived from the FCC’s Form 477 deployment data. This is currently the most comprehensive governmental source of broadband coverage that exists, but it has a number of well-documented flaws.
Chief among them is the caveat that a provider can mark a given census block – the level of granularity used within the form – as “covered” if so little as one home within the block has service in reality. This has led to widespread issues of over-reporting when it comes to where plans are actually available at the neighborhood level. Our internal plan coverage estimates, meanwhile, include areas that report coverage and show at least one active gigabit plan being available to consumers in a given zip code. This is more indicative of reality, due to the aforementioned shortcomings of the government’s dataset.
To illustrate this, we manually checked for gigabit service options in 75 randomly selected addresses across 15 zip codes in Texas, Florida, and Ohio where the FCC’s data indicates that coverage is available. Tellingly, we found that not a single address had an active, gigabit plan available as of 2020. Read the full methodology behind these tests below.
Gigabit expansion through the years according to the FCC
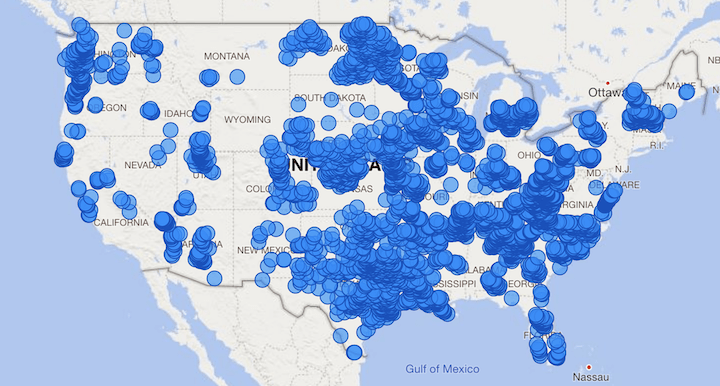
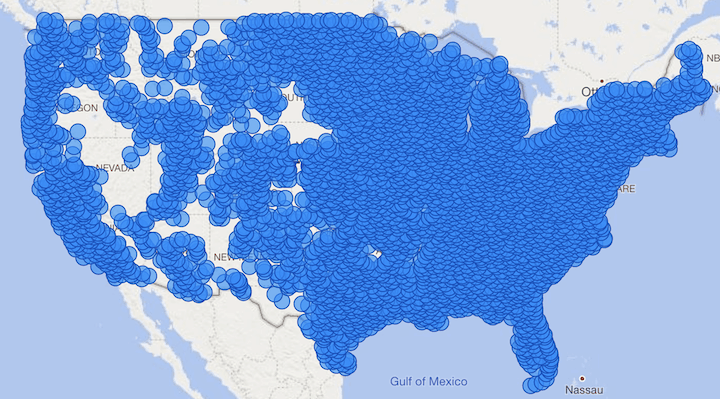
Below, you’ll see a visual representation of fiber coverage as reported yearly to the FCC by internet service providers in the U.S. Once again, these are not active plans, but simply areas that have reported to offer at least one gigabit-capable connection. Taken on its own, one might get the impression that gigabit service is nearly ubiquitous in the U.S. today:
2016
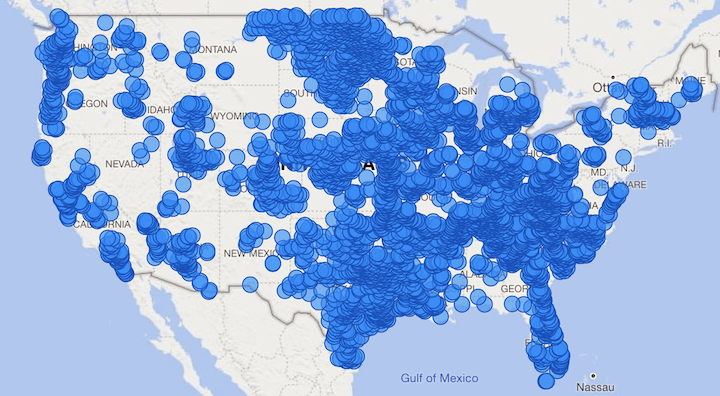
2017
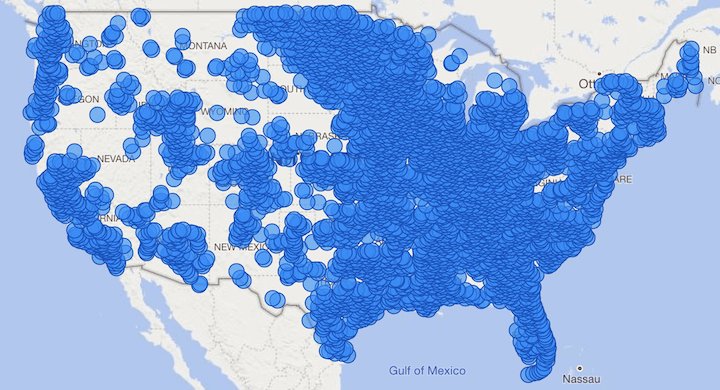
2018
2019
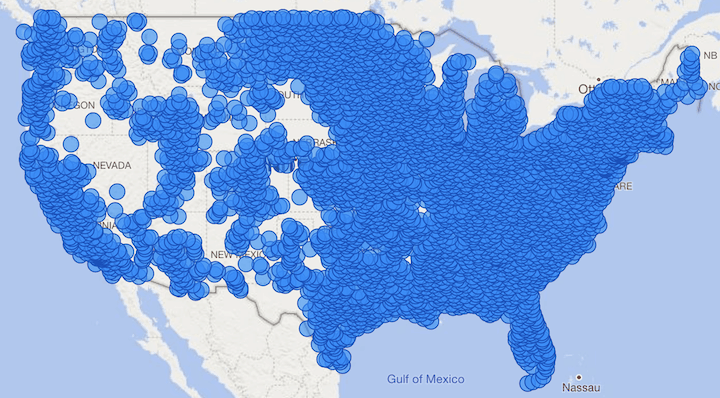
2020
Fiber paves the way
Gigabit services are overwhelmingly provided via a fiber-optic connection. This was, and still is, what makes actual expansion so difficult and slow – it can cost thousands of dollars per home to build the infrastructure out. While other technologies like coaxial cable can technically support a gigabit signal, it can only do so in an asymmetric fashion, meaning the upload speeds are far slower than the download. These cable lines are also far more susceptible to network congestion, meaning that users are less likely to experience the full speeds they are paying for.
Fiber, on the other hand, has an immense amount of bandwidth at scale, allowing for stable, robust connections. In fact, the vast majority of the internet backbone – the part that snakes across the globe, running in undersea cables along the ocean floor, is fiber-based. Unfortunately, though millions of Americans live in areas that may have fiber coverage, the “last mile” segment of the infrastructure, which goes directly to a home or apartment building, is often copper-based instead. This critical issue bottlenecks otherwise robust connections, and is one of the main reasons gigabit coverage information can be so unreliable at scale.
What about other internet service options in the U.S.?
- See how all 50 states rank for internet access, pricing, and speeds. You can also view more specific data on states like Texas, California, and Utah.
- Find information on the top internet service providers in the U.S. such as AT&T, Charter Spectrum, and Xfinity.
- Check out in depth broadband statistics for every city in the county, including internet access in Dallas, Los Angeles, and Detroit.
How fiber availability has expanded (and how we can make it universal)
Despite prohibitive expenses, fiber connections have been expanding rapidly in recent years. This has been made possible by a series of concerted efforts to remove deployment barriers and incentivize deployment of robust technologies over legacy copper.
Government assistance
Federal programs have helped incentivize internet service providers to build out more robust technologies in areas where they otherwise would not be likely to do so, primarily because of low population density (and thus, a lower return on investment).
Municipal partnerships
Across the nation, thousands of cities and towns have taken the digital divide into their own hands, establishing the requisite infrastructure themselves, and creating community broadband networks that are overwhelmingly fiber-to-the-home, by design. These unique solutions have helped rural communities in particular, where healthy competition has long been absent. Unfortunately, many states currently roadblock or outlaw these types of networks.
Smart infrastructure policy
A patchwork series of policies at the state level have helped bring fiber to millions of Americans over the past four years. Chief among these policies is the concept of “dig once” laws, which mandate that infrastructure be placed into the ground to support future fiber expansion during any project involving public rights of way If these sorts of policies were made the national standard, we could accelerate the rate of fiber expansion even further.
About the Data
Historical coverage data for this report comes from FCC form 477 filings from June 2016, June 2017, June 2018, and June 2019 (the most recent release). Because of the FCC reporting lag, these corresponded to the following calendar accordingly: June 2016 to 2017, June 2017 to 2018, June 2018 to 2019, June 2019 to 2020. In this report, we focused on measuring access to the gigabit internet, which we defined as at least 900 Mbps download speed for residential consumers.
Beyond reported speeds, we also looked to see if the providers had standalone internet plans available that matched our gigabit threshold of at least 900 Mbps download speed in that area. We considered plans available in the first half of calendar years 2017-2020 in the analysis. Plan pricing is based on the regular monthly rate offered by standalone internet plans. Promotional rates are only considered if that is the only advertised price publicly available. Population is calculated off of the 2010 U.S. Census.
When manually checking addresses, we selected 15 zip codes in three states where gigabit availability is particularly over-reported: Texas, Florida, and Ohio:
Texas:
- 77867
- 75790
- 77975
- 75440
- 78940
Florida:
- 32330
- 32323
- 32462
- 32465
- 32530
Ohio:
- 44253
- 44677
- 44049
- 44437
- 45813
These zip codes were selected because the FCC currently claims gigabit service is available within them. Five addresses were randomly selected from each zip code. Our team first checked to see if any provider offered technologies capable of producing a gigabit service in these areas. If they did, we checked on the provider’s website to attempt to confirm service availability at the address level. If this information was not attainable on the website, we called the provider directly.